JS Reverse Engineering First Lesson: From Understanding the "Garbled Code" in F12 to Practical Locating of Encryption Logic (A Step-by-Step Tutorial)
Have you ever had this experience: open a website, press F12, go into the Sources panel, find the JS file that looks most critical, and then you're dumbfounded. The screen is full of a, b, c, _0x1234, functions nested within functions, variable names looking like gibberish. You think to yourself: 'Did the programmer who wrote this website not know how to name things?'
Actually, it's not that they don't know how to name things; what you're seeing is simply not what they wrote.
This article first addresses the most discouraging questions: Why does the JS code we see during reverse engineering look completely different from 'normal code'? And: How exactly do you use things like Call Stack, function jumps, and blue underlines in Chrome DevTools? We'll use the Peking University login page as a case study to walk through a complete process in the middle, and finally talk about XHR/Fetch breakpoints—the fallback plan when keyword searches fail, to guide you into JS reverse engineering.
Assume you already know how to press F12 to open the developer tools. If you don't, you do now.
1. Do You Need to Learn JS?
You don't need to know how to write JS, but you must be able to read JS. Reverse engineering is essentially reading comprehension; you're looking at code written by others, not needing to write a project from scratch. It's like being able to read a menu but not cook; it doesn't stop you from ordering.
1. Variables
var a = 1, let b = "hello", const c = 123. The differences between var / let / const are not important in reverse engineering; you just need to know it's assigning a value to a name.
2. Functions
function f(x) { return x + 1 }. Defines a function called f, receives parameter x, returns x + 1. If you see f(5) elsewhere, it's calling it, and the result is 6.
3. Objects
{ name: "Zhang San", age: 18 }. A bunch of key: value pairs wrapped in curly braces. When you see d.e("phone").value, it's accessing property e of object d, then calling it, then taking .value.
4. Arrow Functions
(x) => x + 1, equivalent to function(x) { return x + 1 }. Appears frequently in minified code; you'll get used to it.
5. Callbacks
$.ajax({ success: function(res) { console.log(res) } }), simply put, it's passing a function as a parameter to another function. Login requests, encryption operations almost always come in the form of callbacks.
6. Built-in Functions
Built into the browser, usable without importing. setTimeout(fn, 1000) delays execution, setInterval(fn, 1000) repeats execution, infinite debuggers use this to mess with you. JSON.stringify(obj) converts an object to a string, JSON.parse(str) does the reverse, always called before encryption. document.getElementById("id").value gets input field value, $("#id").val() is the jQuery equivalent, appears in the Peking University case.
When you encounter unfamiliar syntax, just search for it, or throw it to an AI and ask 'What does this JS code mean?' Don't be scared off; you only need to read, not write.
If you didn't even understand
var a = 1, you do now.
2. The First Truth: What You See is Never the 'Source Code'
A normal front-end project is written like this during development:
// Code written by the developer (source code)
function handleSubmitButtonClick(event) {
    const userPhoneNumber = document.getElementById("phone").value;
    const encryptedPassword = md5(document.getElementById("password").value);
    sendLoginRequest(userPhoneNumber, encryptedPassword);
}
Variable names like userPhoneNumber, function names like handleSubmitButtonClick, self-explanatory, clean and clear.
But what you see with F12 is like this:
function a(b){var c=d.e("phone").value,f=g(d.e("password").value);h(c,f)}
a, b, c, d, e, f, g, h, each name no more than two letters.
This is not encryption, not obfuscation, not even deliberately trying to stop you. This is a standard operation in front-end engineering called Minification.
Why do websites do this?
When your browser opens a website, it must first download all JS files. A medium-to-large project might have thousands of lines of code. The variable name handleSubmitButtonClick has 26 characters; changing it to a has only 1 character. Shortening thousands of variable and function names to single letters can reduce file size by 40%–60%.
For a website with millions of daily active users, this means pages load instantly, saving a huge amount on bandwidth and CDN traffic costs. So this isn't the website 'trying to stop you'; it's the website saving traffic for all users, incidentally making it look like gibberish when you reverse engineer it 😂.
What else does minification do?
Besides renaming, minification tools (Webpack, Vite, esbuild, Terser, etc.) also:
| Operation | Effect |
|---|---|
| Remove all spaces and line breaks | The entire file becomes one line |
| Remove comments | All // and /* */ disappear |
| Shorten variable names | userPhoneNumber → a |
| Shorten function names | handleSubmitButtonClick → b |
| Merge statements | Merge into one line whenever possible |
| Tree Shaking | Delete all unused code |
So the abcd gibberish you see is the final product after bundling + minification.
As for real 'code obfuscation' (Obfuscation), like encoding strings, scrambling control flow, adding dead code, that's a further step, saved for the advanced chapter.
3. Introduction to Chrome DevTools
Before starting analysis, first understand which things in DevTools are the core tools for reverse engineering.
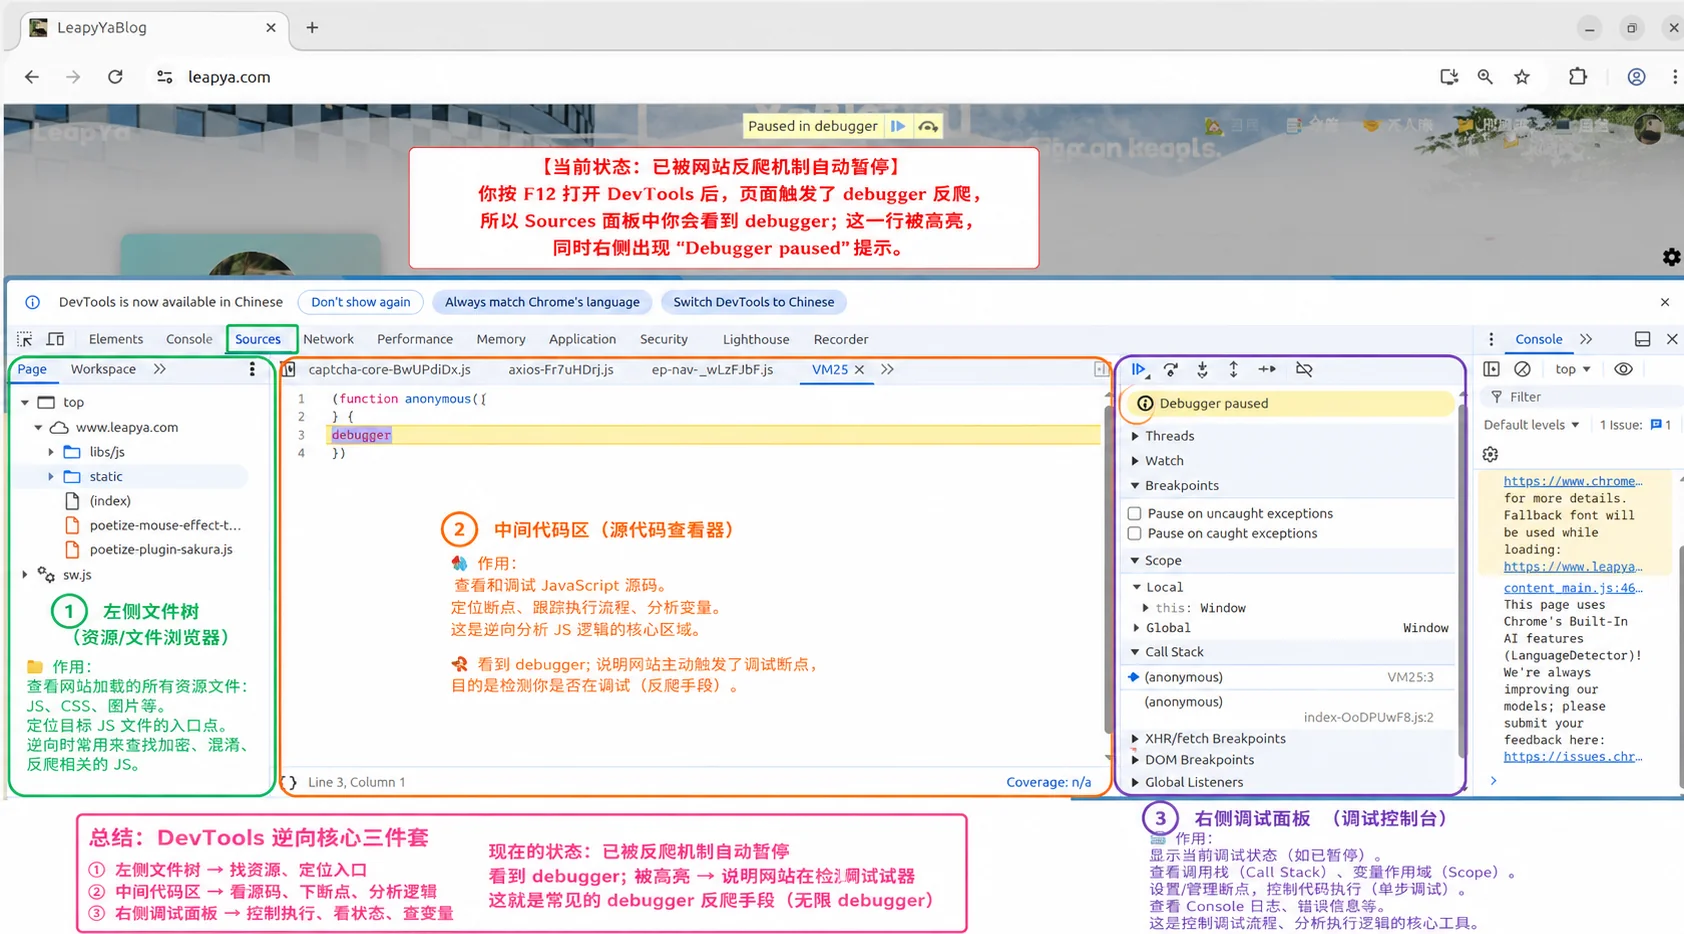
1. Sources Panel (The Core Battlefield)
Press F12 → click the Sources tab. The left side is the file tree, the middle is the code viewing area, the right side is the debugging panel. You'll spend 90% of your time here next.
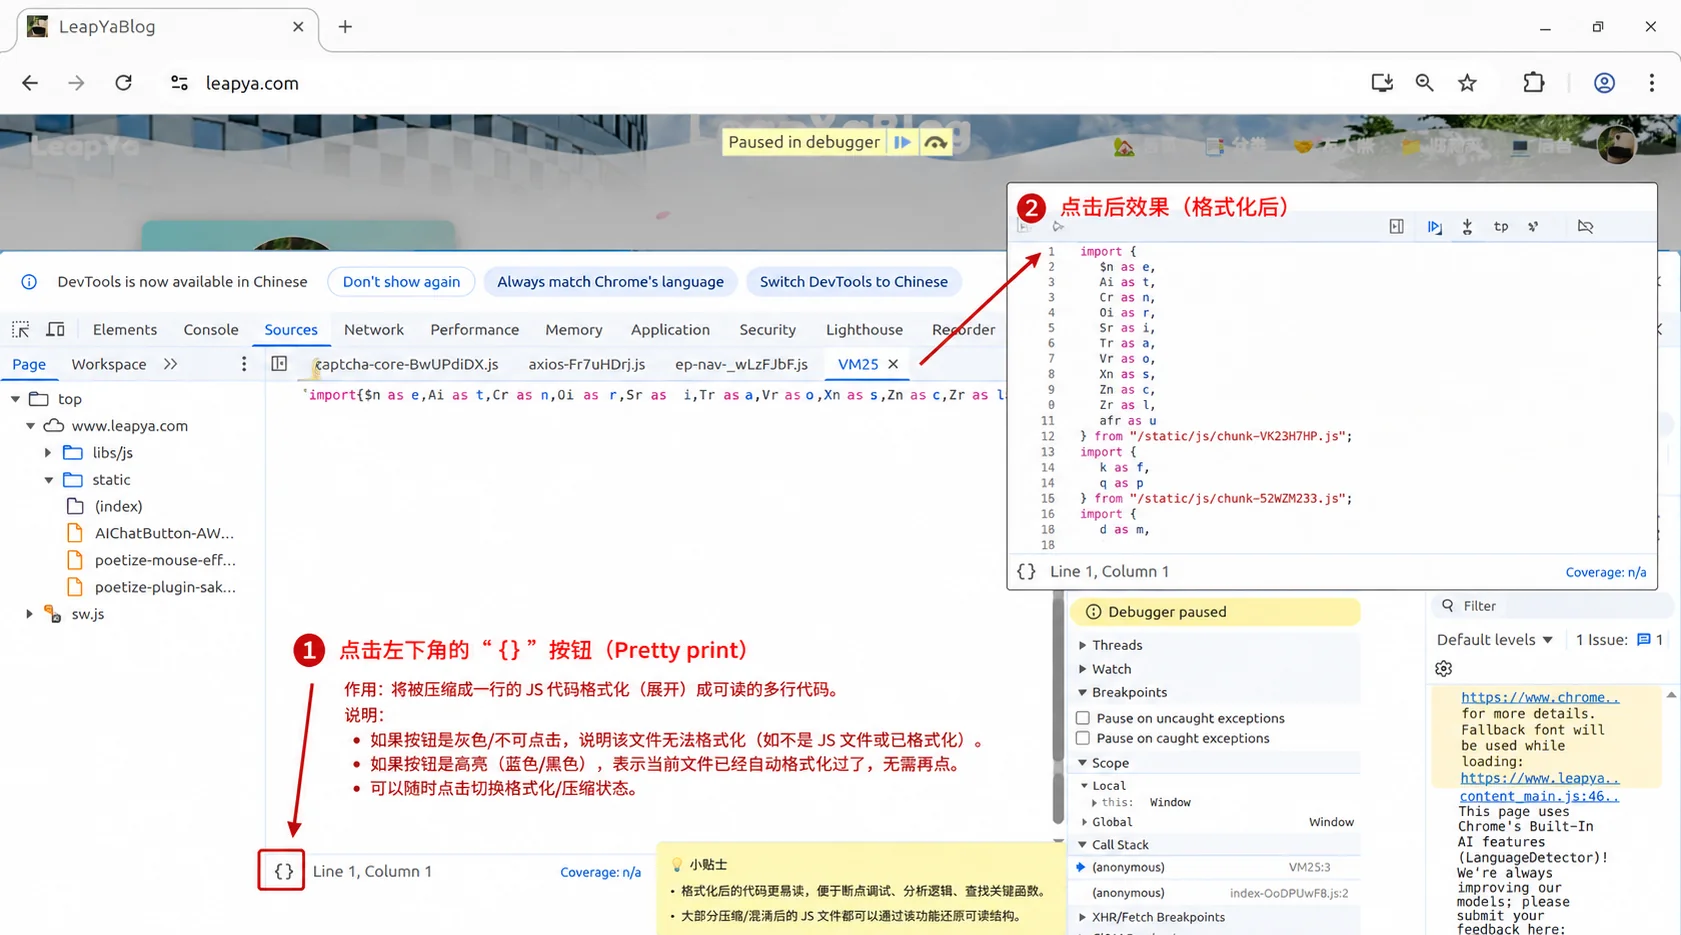
2. First Thing: Use Pretty Print to Format
After opening a JS file minified into one line, click the {} button at the bottom left of the code area (called "Pretty print").
Before formatting:
function a(b){var c=d.e("phone").value,f=g(d.e("password").value);h(c,f)}
After formatting:
function a(b) {
    var c = d.e("phone").value,
        f = g(d.e("password").value);
    h(c, f)
}
This is the first action you take. Without formatting, you won't understand anything.
3. Right-side Debugging Panel
Focus on these three areas:
| Area | English Name | What it's for |
|---|---|---|
| Call Stack | Call Stack | See 'who called whom', core for reverse tracing |
| Scope | Scope | See current variable values, used during breakpoint debugging |
| Breakpoints | Breakpoints | Manage all your breakpoints |
4. Call Stack (Call Stack), The Navigation Map for Reverse Engineering
What is a stack?
Suppose your code looks like this:
function makeBreakfast() {
    fryEgg();
    heatMilk();
}

function fryEgg() {
    crackEgg();
    pourOil();
    turnOnHeat();
}

function crackEgg() {
    console.log("Crack");
}

makeBreakfast();
When the program executes the line console.log("Crack"), the call stack from bottom to top is:
crackEgg        ← You are here
fryEgg          ← fryEgg called crackEgg
makeBreakfast   ← makeBreakfast called fryEgg
(global)        ← The code that started running
This is the Call Stack: It records 'who called whom', the complete trajectory from the entry point to the current location.
How to use it in DevTools?
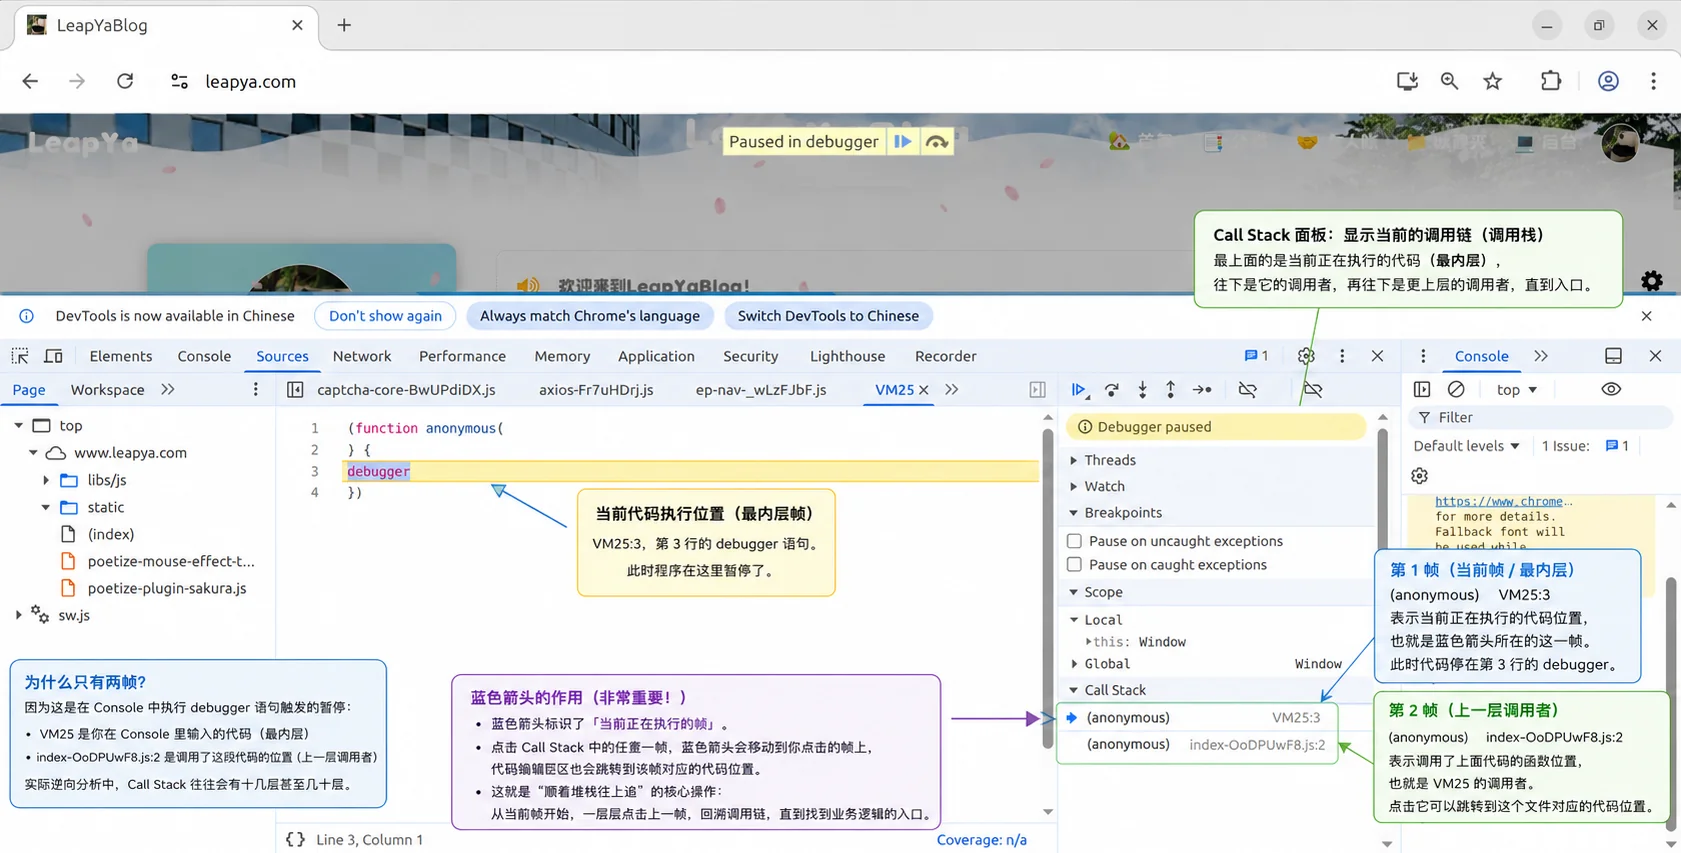
In the Call Stack area on the right side of the Sources panel, when the code stops at a breakpoint, it shows the current call chain.
How to operate:
- In the Sources panel, find the key function you suspect, click the line number to set a breakpoint (a blue arrow appears on the line number)
- Trigger that function (refresh page, click button, etc.)
- Code stops at the breakpoint, right side Call Stack shows the complete call chain
- Click any frame in the stack, the code area automatically jumps to the location corresponding to that frame
This is 'tracing up the stack'. You can start from a low-level function and follow the stack layer by layer to find who called it, ultimately locating the business logic.
Business logic is usually in the middle few frames of the Call Stack, the topmost are request/monitoring layers, the bottommost are event trigger layers. Find frames with business filenames, focus on those layers.
Just remember this concept for now. When Call Stack truly comes in handy is explained in Section Seven; before that, there are simpler methods.
5. Why Does Clicking on a() Jump to b(){}?
This is one of the most confusing phenomena for beginners.
In DevTools, when you hover over a function call (like a()), a popup appears with a blue underlined function name (like b). Clicking it makes the code area jump to the function definition, and then you see:
function b(c, d) {
    // ...
}
You called a(), how did you jump to b?
Actually, a is just a variable name, not a function name
In minified code, a function often doesn't exist directly in the form of a 'function declaration'. It's often like this:
// Original source code (your guess)
function sendLoginRequest(phone, encryptedPwd) {
    axios.post("/api/login", { phone: phone, password: encryptedPwd });
}

// After minification (what you actually see)
var a = function (b, c) {
    d.post("/api/login", { phone: b, password: c });
};
Here a is a variable, its value is a function. When DevTools displays a function reference, it shows the internal name of the function entity itself. You hover over a, it tells you the function entity a points to is called b, so jumping there naturally shows function b(){}.
More common is multi-level assignment like this:
var e = function () { /* actual working code */ };
var d = e;
// ...
d();  // ← You hover here, it shows e, jumping also shows e
d points to e, so hovering over d() shows e.
Then why do some functions show nothing when hovered?
Two situations:
- It's a browser built-in function. Like
setTimeout,JSON.stringify,document.getElementById. These are natively implemented by the browser, no JS source code to jump to. - It's a dynamically generated anonymous function. Like one created by
new Function("return 1"), itself has no name.
6. Walkthrough a Complete Practical Example Using the Peking University Login Page
The previous sections were groundwork. Now let's walk through a complete process using the Peking University unified identity authentication login page (iaaa.pku.edu.cn).
Step 1: Search for Keywords
F12 → Sources → Ctrl+Shift+F global search for encrypt.
The second search result shows a very suspicious line of code:
encryptedPWD = crypt.encrypt($("#password").val());
Step 2: Set a Breakpoint
Click into that file, click the line number on this line to set a blue breakpoint.
Step 3: Trigger
Enter any password on the login page, click login. The code stops at the breakpoint.
Step 4: Check the Result
After the breakpoint stops, look at the right Scope panel, you'll see the value of $("#password").val() is the plaintext password you entered. crypt.encrypt() is the encryption function; the plaintext password is passed in, and the encryption result is assigned to encryptedPWD.
Now look at the right Call Stack:
crypt.encrypt    ← Encryption call
oauthLogon       ← Login function
onClick          ← Button click
Only two useful frames. This is good, it means the code structure is simple; you don't need to trace layer by layer up the stack, the code at the breakpoint is already clear.
Summary of the Most Common Method to Find Encryption
This is the most common routine for finding encryption logic in JS reverse engineering:
Ctrl+Shift+Fsearch for keywords likepassword,encrypt- Find suspicious functions, set breakpoints
- Trigger the operation on the webpage (enter password, click login)
- Breakpoint triggers, check variable values in Scope
- If the current frame isn't clear enough, use Call Stack to trace up
For Peking University login, Bilibili login, and most websites you'll encounter, this method is sufficient.
7. What If Keywords Aren't Found? Try XHR/Fetch Breakpoints
The routine from the previous section has a prerequisite: the keywords are still in the source code. But if the website is minified too heavily, or has extra obfuscation added, words like encrypt, password simply don't exist in the source code; any search returns empty.
Then you need to change your approach: Don't look at the code, look at the behavior. No matter how minified the code is, the login request must eventually be sent. Intercept it the moment it's sent, then trace back from the Call Stack.
This is where Call Stack truly comes into play.
What are XHR and Fetch?
Web pages must use one of these two APIs to send network requests:
| API | Characteristics |
|---|---|
XMLHttpRequest (XHR) | The older way of making requests, mainstream in the jQuery era |
fetch | The newer way of making requests, default for modern frameworks like Vue/React |
Don't know which one the website uses? Just set breakpoints for both.
How to Set XHR/Fetch Breakpoints?
We first use the Network panel to capture the login interface's URL, then fill it into the XHR/Fetch breakpoint. Here we use a certain e-commerce site's login page as an example.
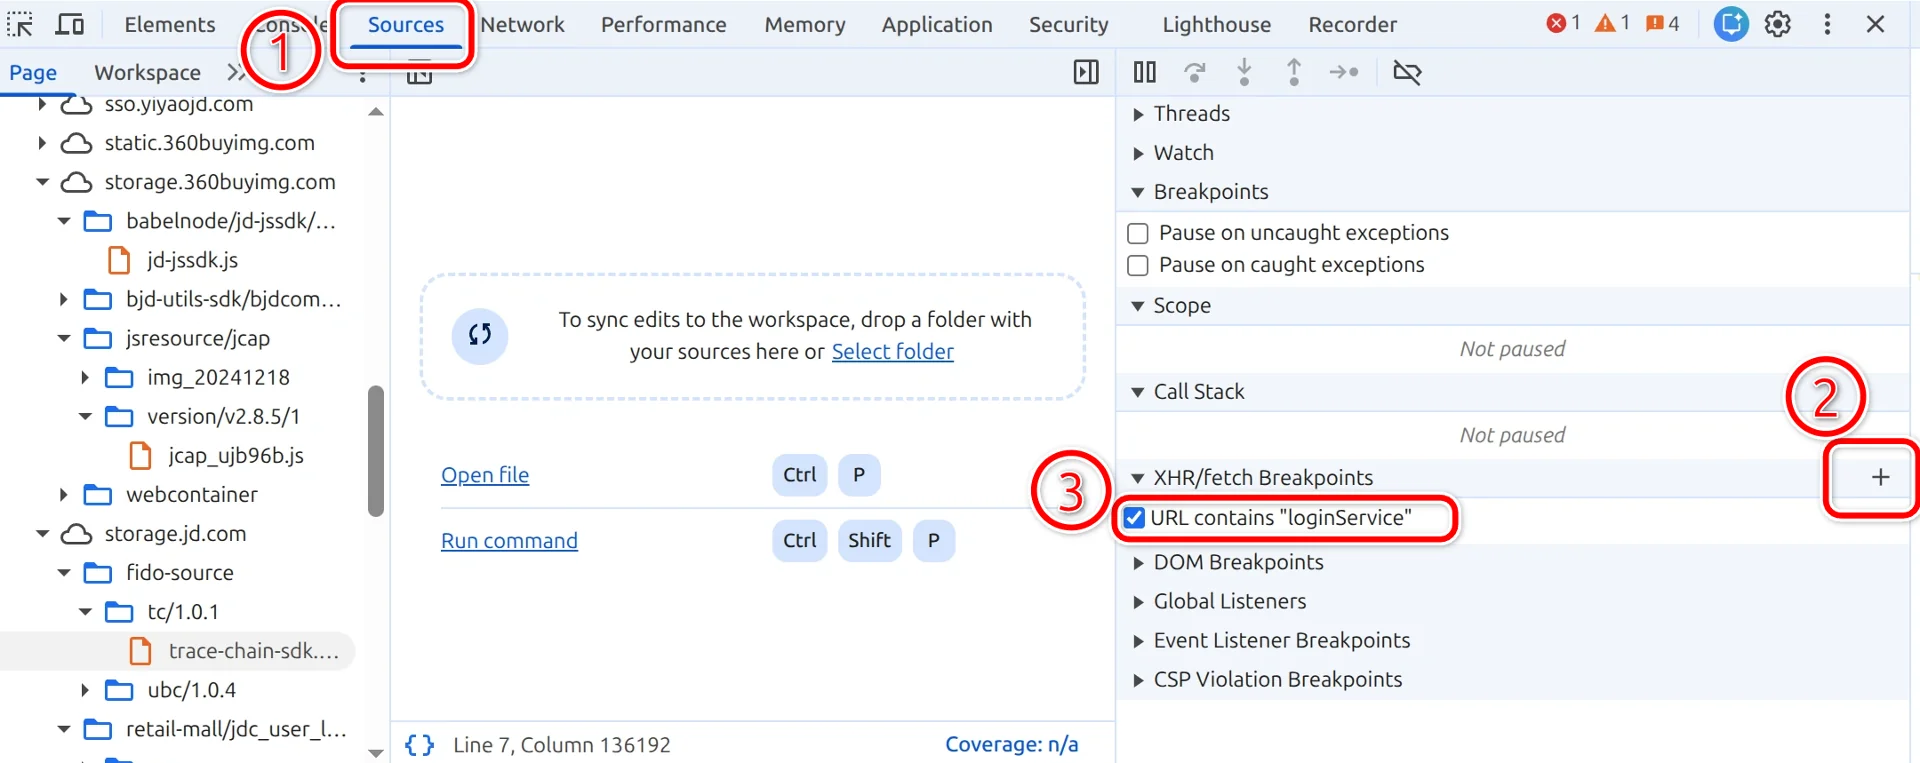
- Open the Sources panel
- Find the XHR/fetch Breakpoints area on the right debugging panel (alongside Call Stack, Scope, Breakpoints)
- Click the
+sign to add a breakpoint rule - Enter a key fragment of the URL. First use the Network panel to look at the login request address once (e.g.,
https://xxx.com/api/user/login), take a unique fragment from it (e.g.,login) and fill it in. This way, only requests containingloginwill be intercepted - Check to enable
How to Trigger It? And How to Use Call Stack to Follow the Trail?
On the login page, enter account/password, click login, the code stops at fetch or XMLHttpRequest.send. At this moment, the code stops at the browser's core location for sending network requests.
At this time, the right Call Stack will be much longer, generally like this:
Monitoring/Request Interception Layer ← XHR breakpoint usually stops here (skip)
jQuery send / ajax
Encryption/Signature Function         ← Your target to find
login Login Function                  ← Focus on these frames
proceedWithLogin
Captcha Callback / Event Dispatch     ← Trigger source (skip)
💡 Business logic is usually in the middle few frames of the Call Stack. The top few frames are often request sending layers (jQuery, monitoring SDKs, etc.), the bottom few frames are event trigger layers (button clicks, captcha callbacks, etc.); both ends can be skipped. The encryption logic you're looking for is usually in the middle few frames with business filenames.
But how to quickly distinguish which frames to look at and which to skip? You don't need to click in and look at the code; just looking at the filename on the right can tell:
| Filename Characteristics | Most Likely Is | Action |
|---|---|---|
Contains sdk, min, version numbers (e.g., trace-chain-sdk.umd.min.js) | Third-party SDK | Skip |
Clearly a library name (jquery-1.6.4.js, vue.js) | Framework | Skip |
Name looks like gibberish (jcap_ujb96b.js) | Obfuscated SDK | Skip |
Name is normal English words (login2024.js, user.js, pay.js) | Business Code | ⭐ Focus |
Find filenames with business keywords, click into those frames.
Click through each frame, observe the code and variables in Scope for each layer. You'll eventually find a function: its code contains keywords like MD5, SHA256, AES, sign, or generates strings you don't understand. That's the encryption logic.
Let's take a certain e-commerce site as an example:
How to Know If You Found the Right One?
Run the extracted encryption function in Node.js and compare with the captured packet result:
const crypto = require("crypto");
const result = crypto.createHash("md5").update("123456").digest("hex");
console.log(result);  // e10adc3949ba59abbe56e057f20f883e
If it matches, you've found it correctly 🎉.
Still Not Working? Try Event Listener Breakpoints
If XHR/Fetch breakpoints aren't suitable for your scenario, there's another backup:
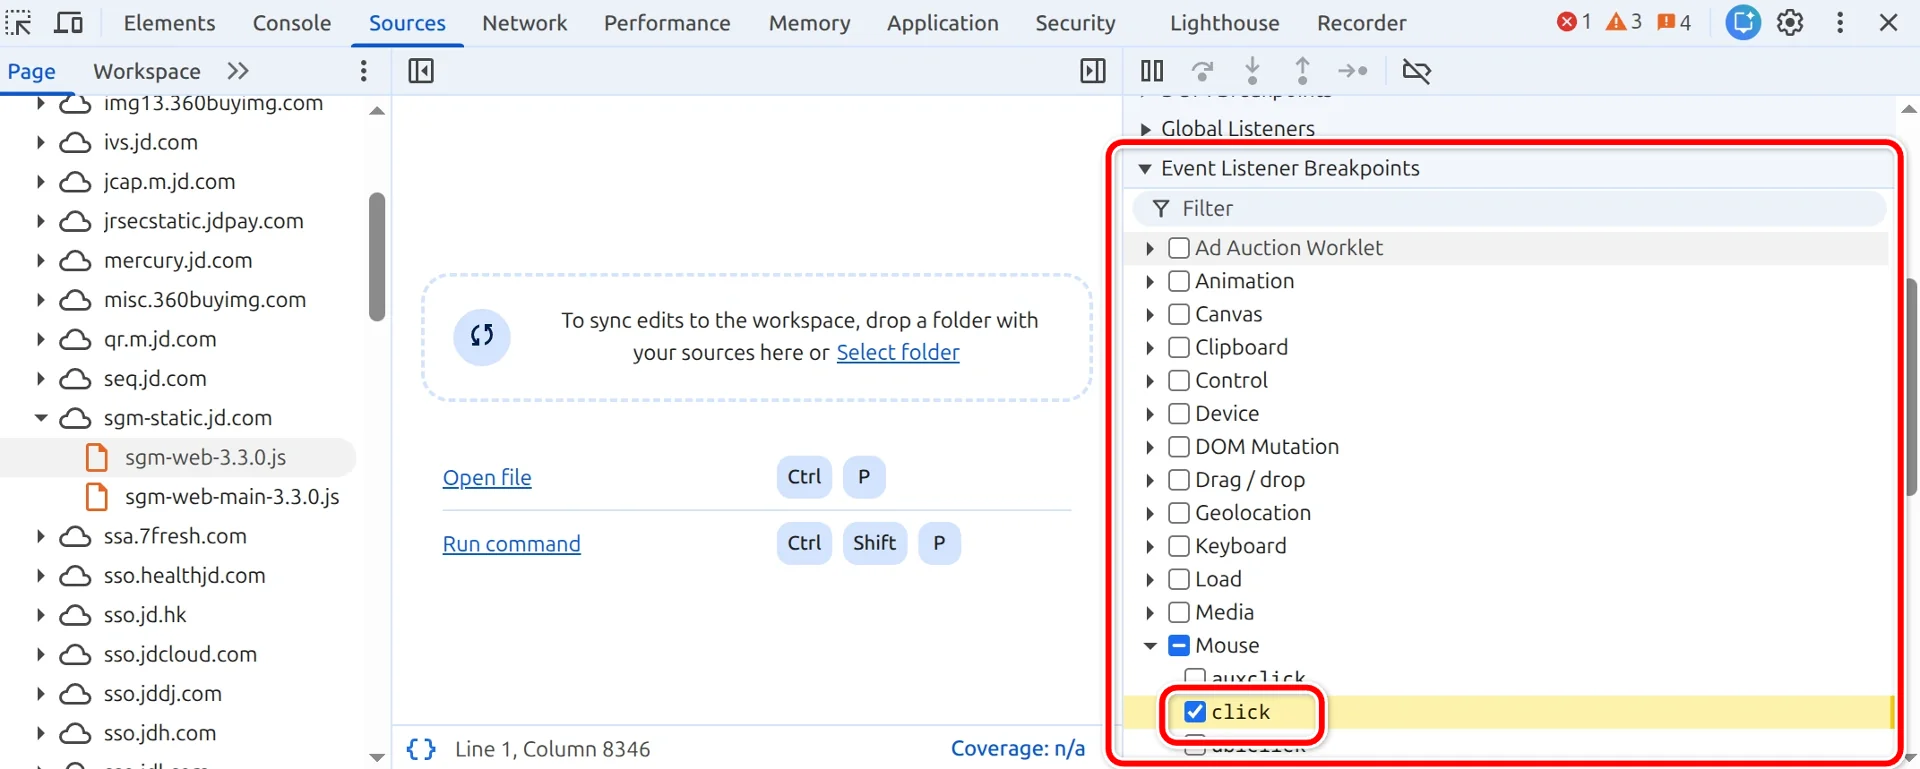
In the Sources panel, find Event Listener Breakpoints on the right → expand Mouse → check click. After this, any mouse click event will trigger a breakpoint. Trace down from the Call Stack, you can also find the encryption logic.
🎉 By now, you've officially entered the world of JS reverse engineering.
Being able to open DevTools, understand minified code, find key encryption functions—these are the core foundational skills of reverse engineering. Don't underestimate this step; many people give up stuck at 'not knowing where to look after opening F12,' but you've made it here.
📖 This article solved 'understanding code' + 'finding key functions'. Next article:
《JS Reverse Engineering Second Lesson: Cailian Press Reverse Engineering Practical》
Using what you learned in the first lesson, practically reverse engineer Cailian Press, walking through the complete process from packet capture to locating encryption logic.
⚠️ Disclaimer: The techniques introduced in this article (Chrome DevTools debugging, code analysis) are general skills for front-end development and security research, widely used in performance analysis, bug troubleshooting, and legitimate security testing. Please do not use them for illegal intrusion, unauthorized data scraping, or other actions that violate laws and regulations.